Receipt Raccoon

2025 | Grocery Tracking App

Receipt Raccoon UI

Receipt Raccoon is my first ever programming project outside of coursework. I learned how to connect between all the difference softwares and services to get a product that I'm excited to use and refine!

ROLE

Developer

TOOLS

Motivation

My motivation for this project started when I was first completely responsible for buying and cooking my own food. I've always been interested in understanding what I purchase on each grocery run and understand the factors that influence them (whether that's an influx of frozen foods during finals season or more plentiful fruit selection based on the season).

Because of this, I've been taking photos of my grocery receipts for the past few months in preperation of this build. This gave way to Receipt Raccoon, where I'm able to upload those receipts and run the data analytics on them in an attempt to better undertand my grocery spending.

Backend | Discord Bot

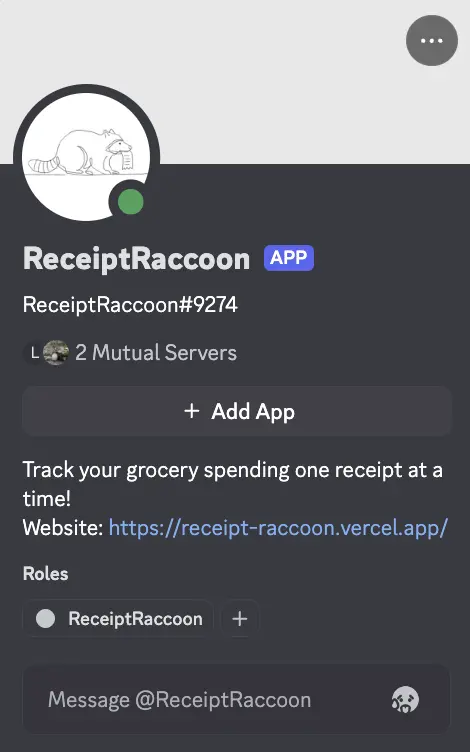
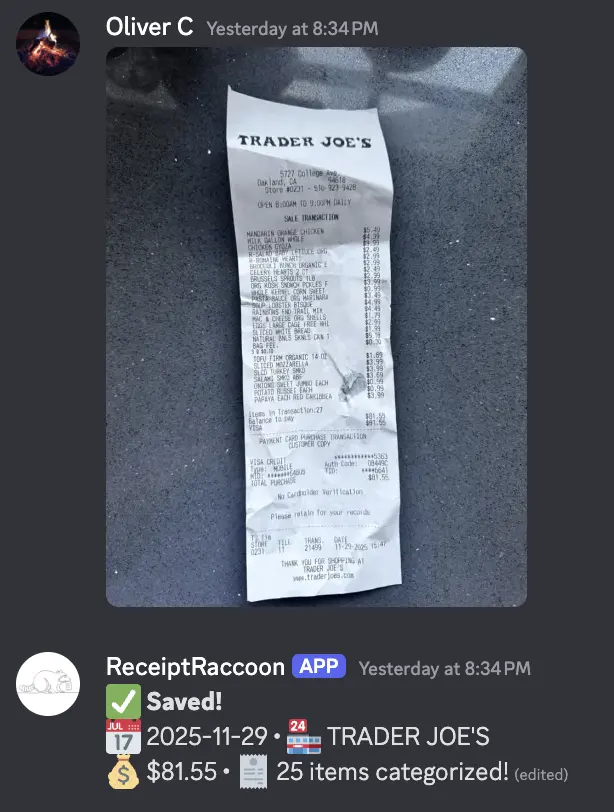
The entry point of the stack is a Python-based bot running on the `discord.py` library. I choose to use Discord as the primary user input method because of it's convenience and easy to learn scalability so that my friends could also use the app without installing anything else. To make it as easy as possible for anyone use, one just needs to upload a receipt to a specific channel on our friends server. The Discord bot then parses natural language commands to derive information from the receipts

Discord Interface
Discord Commands

1. Vision-Language Processing

Instead of parsing text commands, the bot accepts raw image uploads. It streams the image bytes directly to the Gemini API with a strict JSON Schema constraint. This ensures that unstructured data (Store Name, Address, Line Items) is returned in a predictable format that matches our Supabase tables, regardless of the receipt's layout.

2. Async Tasks & Reliability

The bot utilizes discord.ext.tasks to maintain system health without blocking user interactions:

Source Code: bot.py

import os
import discord
import json
import uuid
import asyncio
from discord.ext import commands, tasks
from dotenv import load_dotenv
import google.generativeai as genai
from supabase import create_client, Client
import datetime

# 1. Load Secrets
load_dotenv()
DISCORD_TOKEN = os.getenv('DISCORD_TOKEN')
GEMINI_KEY = os.getenv('GEMINI_API_KEY')
SUPABASE_URL = os.getenv('SUPABASE_URL')
SUPABASE_KEY = os.getenv('SUPABASE_KEY')

# 2. Setup Services
genai.configure(api_key=GEMINI_KEY)

# Force JSON output for receipt extraction
model = genai.GenerativeModel(
    'gemini-2.5-flash',
    generation_config={"response_mime_type": "application/json"}
)

supabase: Client = create_client(SUPABASE_URL, SUPABASE_KEY)

intents = discord.Intents.default()
intents.message_content = True
intents.members = True
bot = commands.Bot(command_prefix='!', intents=intents)

VALID_CATEGORIES = [
    "Fruits", "Vegetables", "Meat / Fish", "Dairy & Eggs",
    "Grains & Staples", "Frozen Foods", "Snacks & Sweets",
    "Condiments & Cooking Ingredients", "Toiletries", "Misc"
]


@bot.event
async def on_ready():
    print(f'Logged in as {bot.user}!')
    # Start tasks safely
    if not scheduled_sync.is_running():
        scheduled_sync.start()
    if not heartbeat.is_running():
        heartbeat.start()


@bot.command(name='sync')
async def sync_profile(ctx):
    """Manually updates the user's profile immediately"""
    msg = await ctx.send("๐Ÿ”„ Syncing profile...")
    try:
        user_data = {
            "discord_id": str(ctx.author.id),
            "display_name": ctx.author.display_name,
            "handle": ctx.author.name,
            "avatar_url": str(ctx.author.display_avatar.url)
        }
        supabase.table("users").upsert(user_data).execute()
        await msg.edit(content=f"โœ… **Synced!** Handle updated to: @{ctx.author.name}")
    except Exception as e:
        await msg.edit(content=f"โŒ Error: {e}")


@bot.event
async def on_message(message):
    if message.author == bot.user:
        return

    if message.attachments:
        attachment = message.attachments[0]
        if attachment.content_type and attachment.content_type.startswith('image/'):

            status_msg = await message.channel.send("๐Ÿ‘€ Processing Receipt...")

            try:
                # A. Download Image
                image_bytes = await attachment.read()

                # B. Upload to Storage
                file_ext = attachment.filename.split('.')[-1]
                file_name = f"{uuid.uuid4()}.{file_ext}"

                supabase.storage.from_("receipts").upload(
                    file=image_bytes,
                    path=file_name,
                    file_options={"content-type": attachment.content_type}
                )
                image_url = supabase.storage.from_("receipts").get_public_url(file_name)

                # C. Analyze with Gemini
                prompt = f"""
                Analyze this receipt image. Extract data into this JSON schema:
                {{
                    "store": str,
                    "address": str,
                    "date": "YYYY-MM-DD",
                    "total": float,
                    "items": [
                        {{"name": str, "price": float, "category": str}}
                    ]
                }}
                Use EXACTLY one category: {json.dumps(VALID_CATEGORIES)}
                """

                response = await asyncio.to_thread(
                    model.generate_content,
                    [prompt, {"mime_type": attachment.content_type, "data": image_bytes}]
                )
                data = json.loads(response.text)

                # D. Update User
                user_data = {
                    "discord_id": str(message.author.id),
                    "display_name": message.author.display_name,
                    "handle": message.author.name,
                    "avatar_url": str(message.author.display_avatar.url)
                }
                supabase.table("users").upsert(user_data).execute()

                # E. Save Receipt
                receipt_entry = {
                    "discord_user_id": str(message.author.id),
                    "store_name": data.get("store", "Unknown Store"),
                    "store_address": data.get("address"),
                    "purchase_date": data.get("date"),
                    "total_amount": data.get("total", 0.0),
                    "image_url": image_url
                }
                response_db = supabase.table("receipts").insert(receipt_entry).execute()
                new_receipt_id = response_db.data[0]['id']

                # F. Save Items
                items_to_insert = [
                    {
                        "receipt_id": new_receipt_id,
                        "name": item['name'],
                        "price": item['price'],
                        "category": item['category']
                    } for item in data.get("items", [])
                ]
                if items_to_insert:
                    supabase.table("receipt_items").insert(items_to_insert).execute()

                # --- G. NEW: FETCH CUSTOM BOT RESPONSE ---
                user_id = str(message.author.id)
                user_query = supabase.table("users").select("bot_response_template").eq("discord_id",
                                                                                        user_id).single().execute()

                # Use custom template if exists, otherwise use a default fallback
                custom_template = user_query.data.get("bot_response_template") if user_query.data else None
                success_intro = custom_template if custom_template else "โœ… **Saved!**"

                display_date = data.get('date', 'Unknown Date')
                await status_msg.edit(
                    content=f"{success_intro}\n๐Ÿ“… {display_date} โ€ข ๐Ÿช {data.get('store', 'Unknown')}\n๐Ÿ’ฐ ${data.get('total', 0)} โ€ข ๐Ÿงพ {len(items_to_insert)} items categorized!"
                )

            except Exception as e:
                await status_msg.edit(content=f"โŒ Error: {str(e)}")
                print(f"Error: {e}")

    await bot.process_commands(message)


# --- TASKS ---
@tasks.loop(hours=24)
async def scheduled_sync():
    print("โฐ Running daily profile sync...")
    for guild in bot.guilds:
        for member in guild.members:
            if not member.bot:
                user_data = {
                    "discord_id": str(member.id),
                    "display_name": member.display_name,
                    "handle": member.name,
                    "avatar_url": str(member.display_avatar.url)
                }
                try:
                    supabase.table("users").upsert(user_data).execute()
                except:
                    continue


@tasks.loop(seconds=60)
async def heartbeat():
    try:
        current_time = datetime.datetime.now(datetime.timezone.utc).isoformat()
        supabase.table("system_status").upsert({
            "service_name": "discord_bot",
            "last_heartbeat": current_time
        }).execute()
    except Exception as e:
        print(f"โŒ Heartbeat failed: {e}")


bot.run(DISCORD_TOKEN)

Database Architecture | Supabase

In order to have a place to store all of the data, I used Supabase and integrated it so that the Discord bot can add entries the the tables.
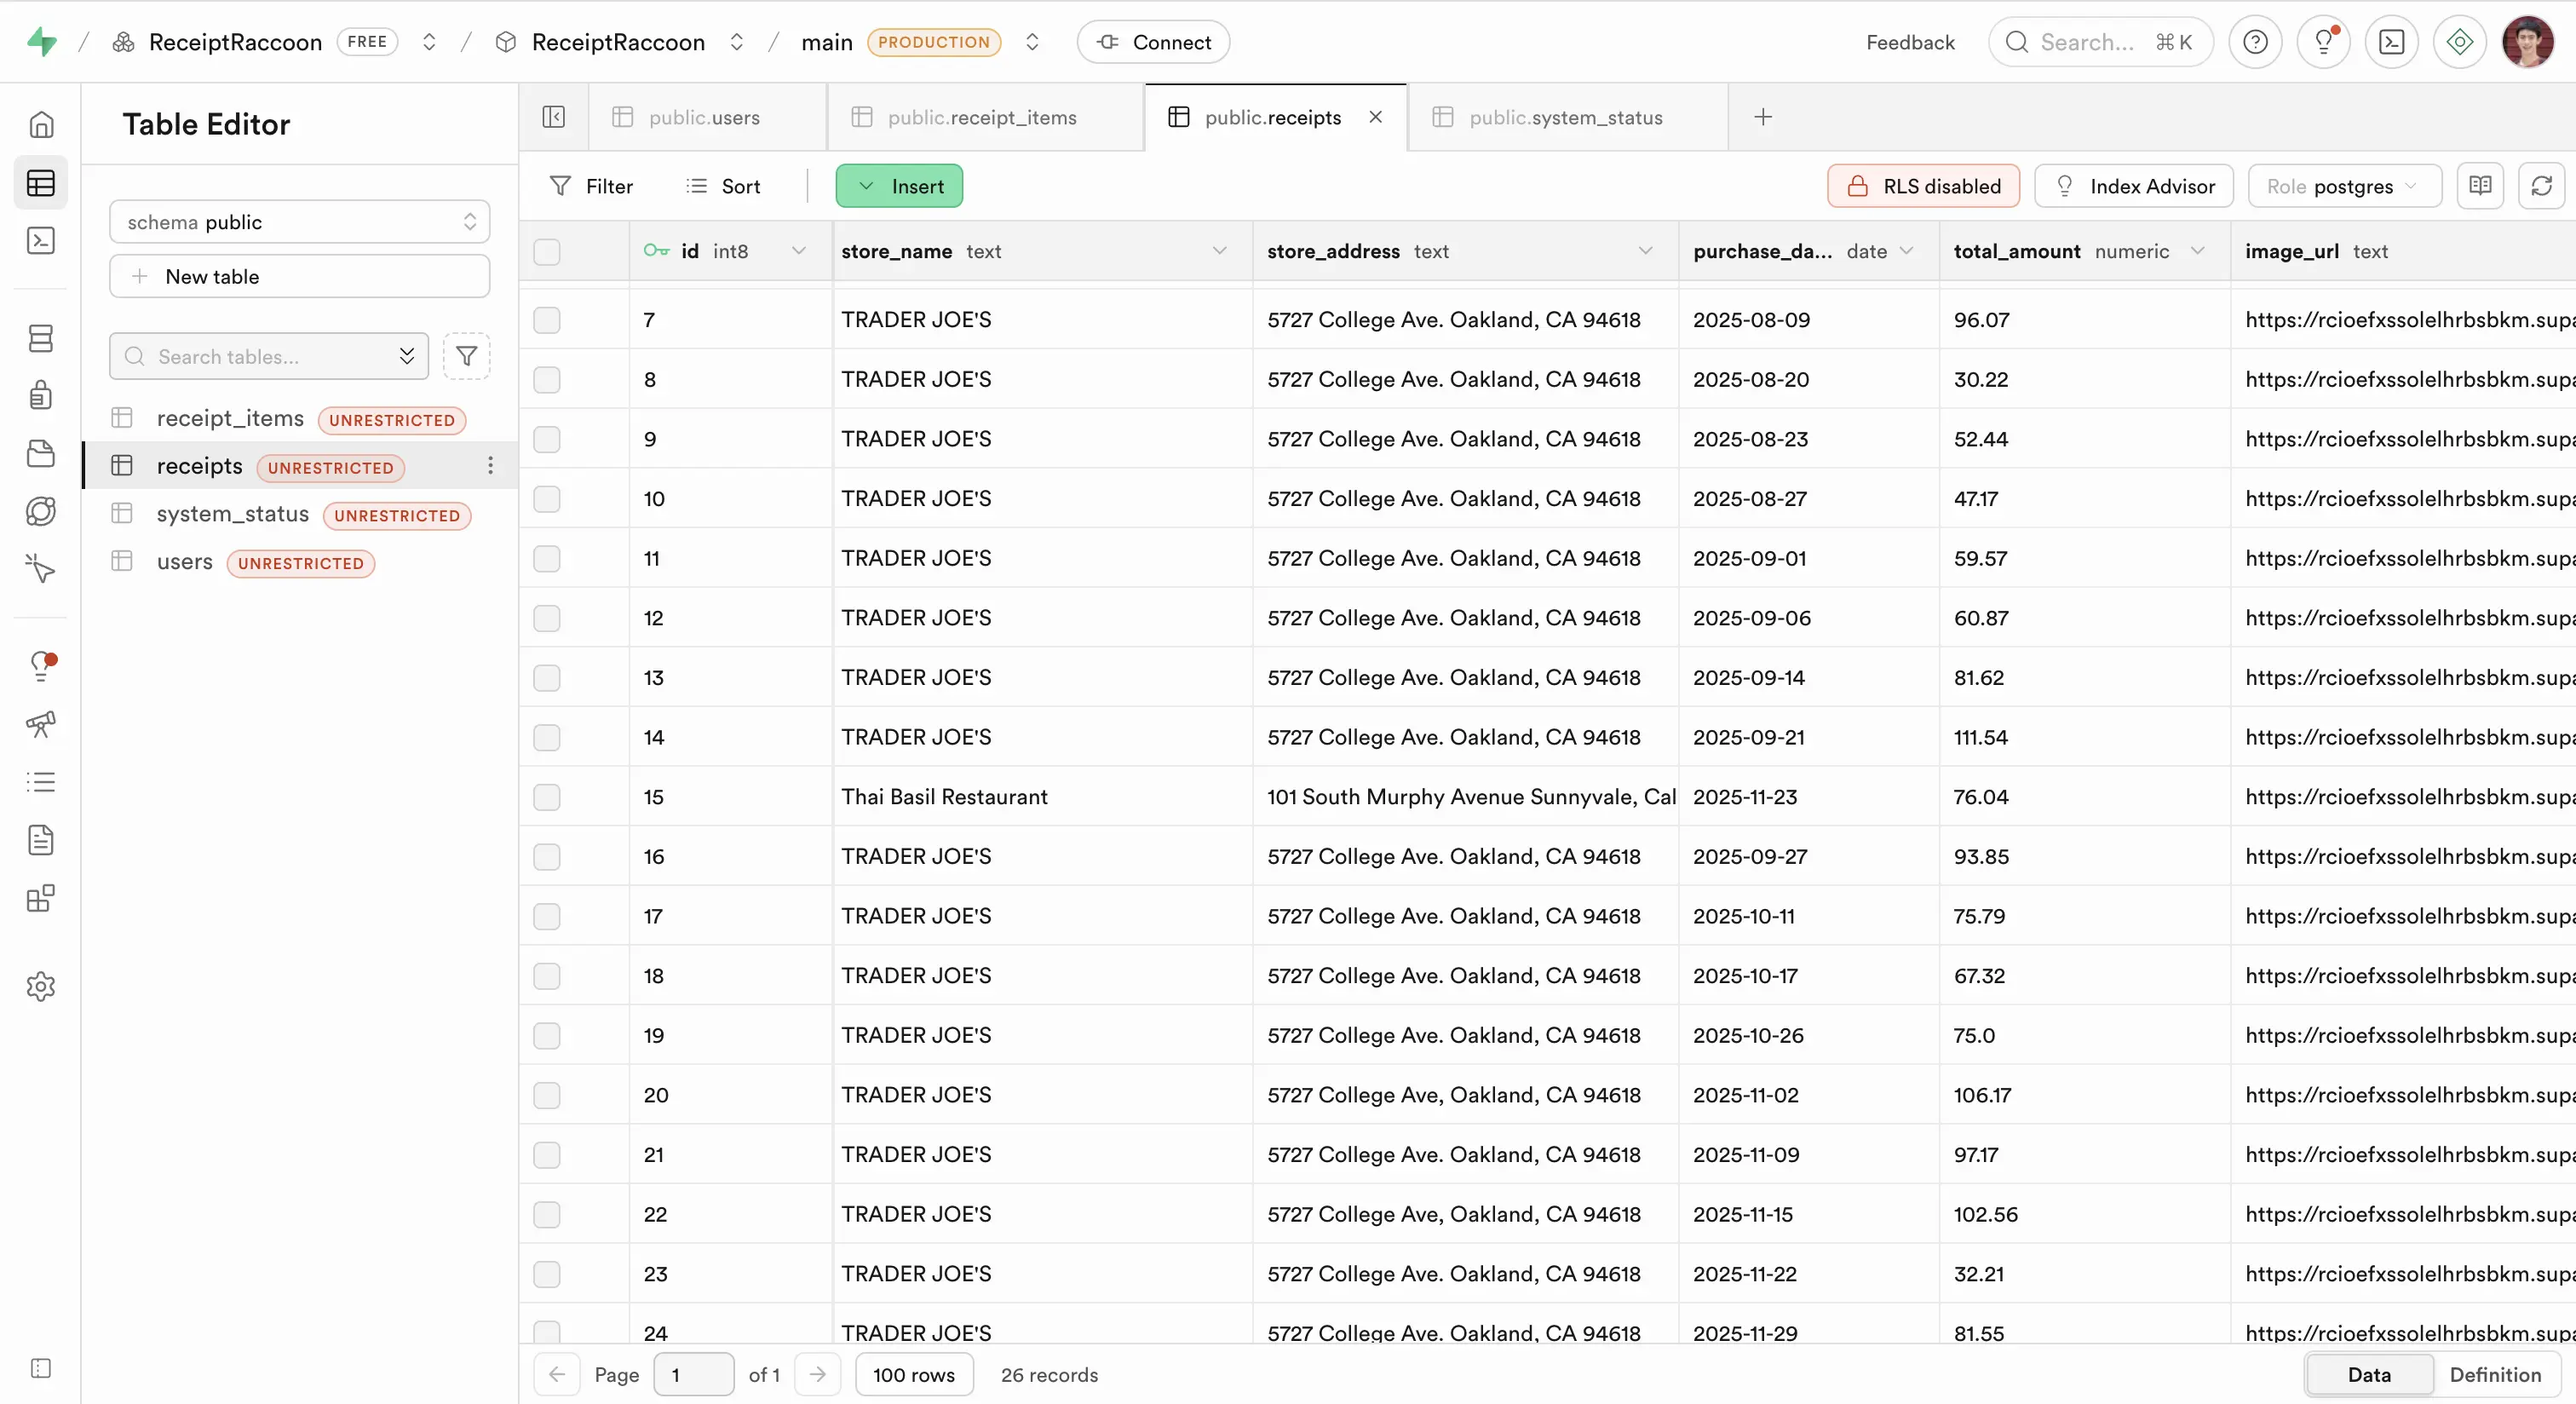
Backend Logic

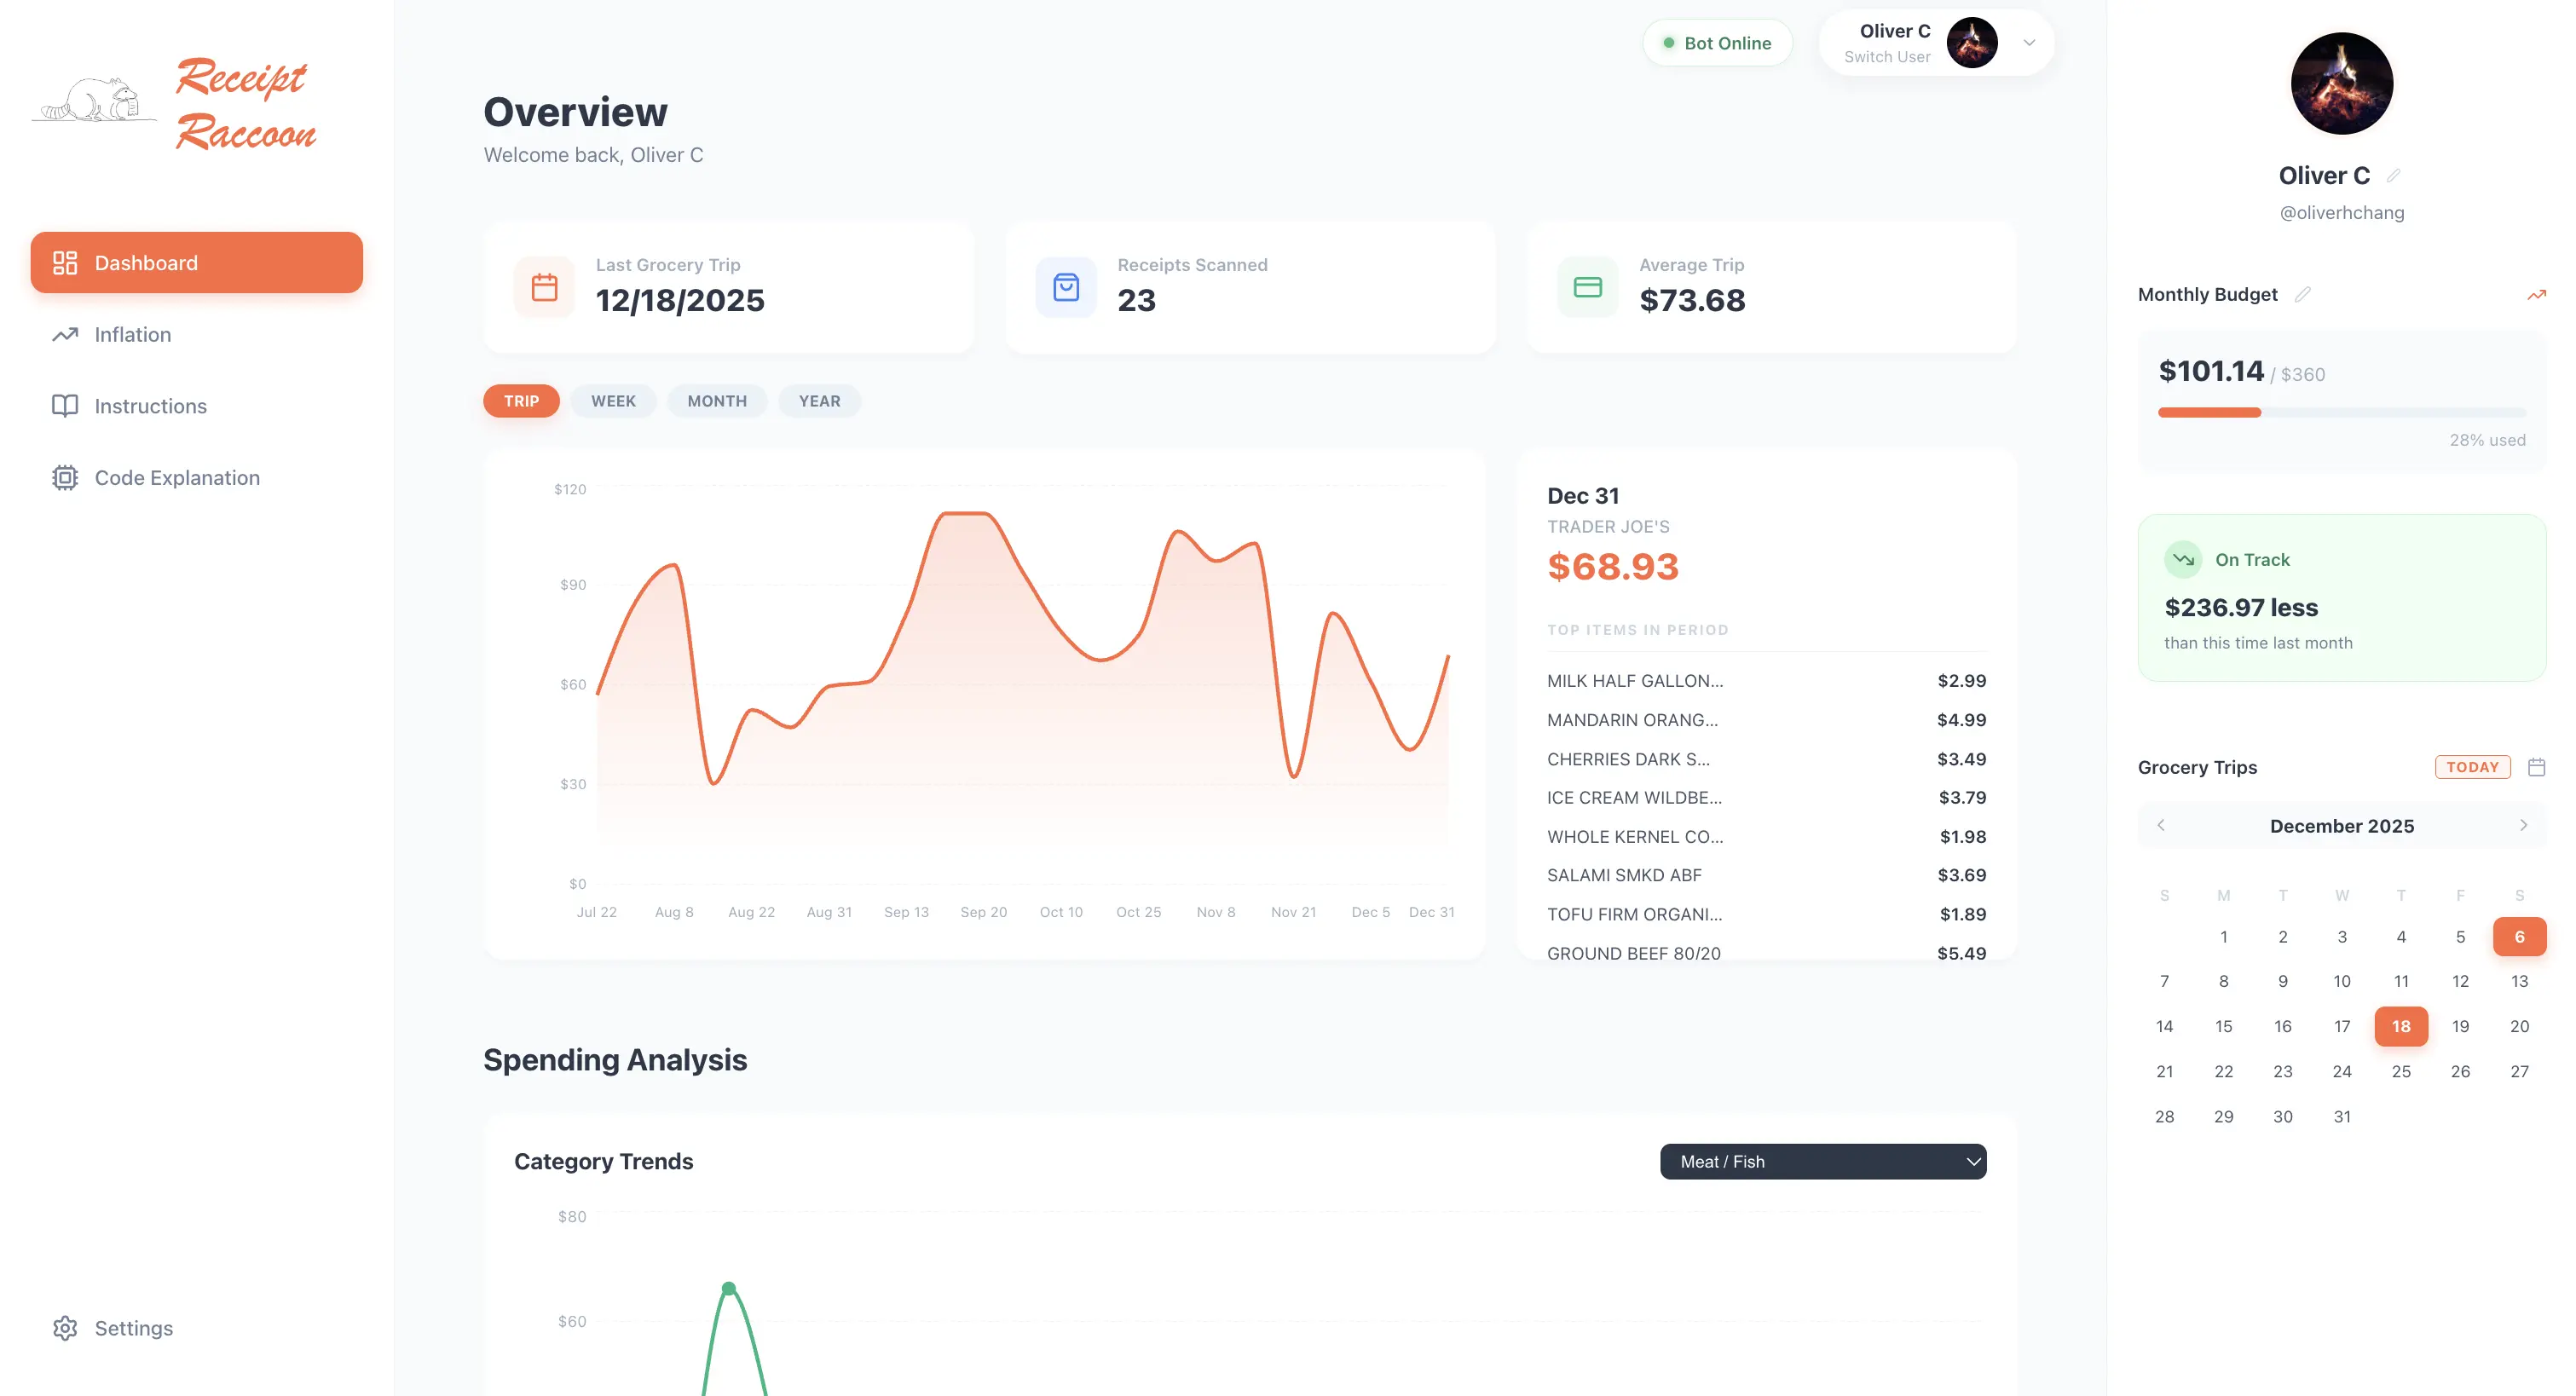
The Frontend: React & Vite

The visualization layer is built using React with Vite. Deployed on Vercel, the site offers a responsive dashboard that fetches live data.

Dashboard View
File Structure

State Management

The app leverages React Hooks (`useEffect`, `useState`) to manage the asynchronous data fetching lifecycle. This ensures the dashboard reflects real-time changes made via the Discord bot without requiring a hard refresh.

Engineering the Dashboard

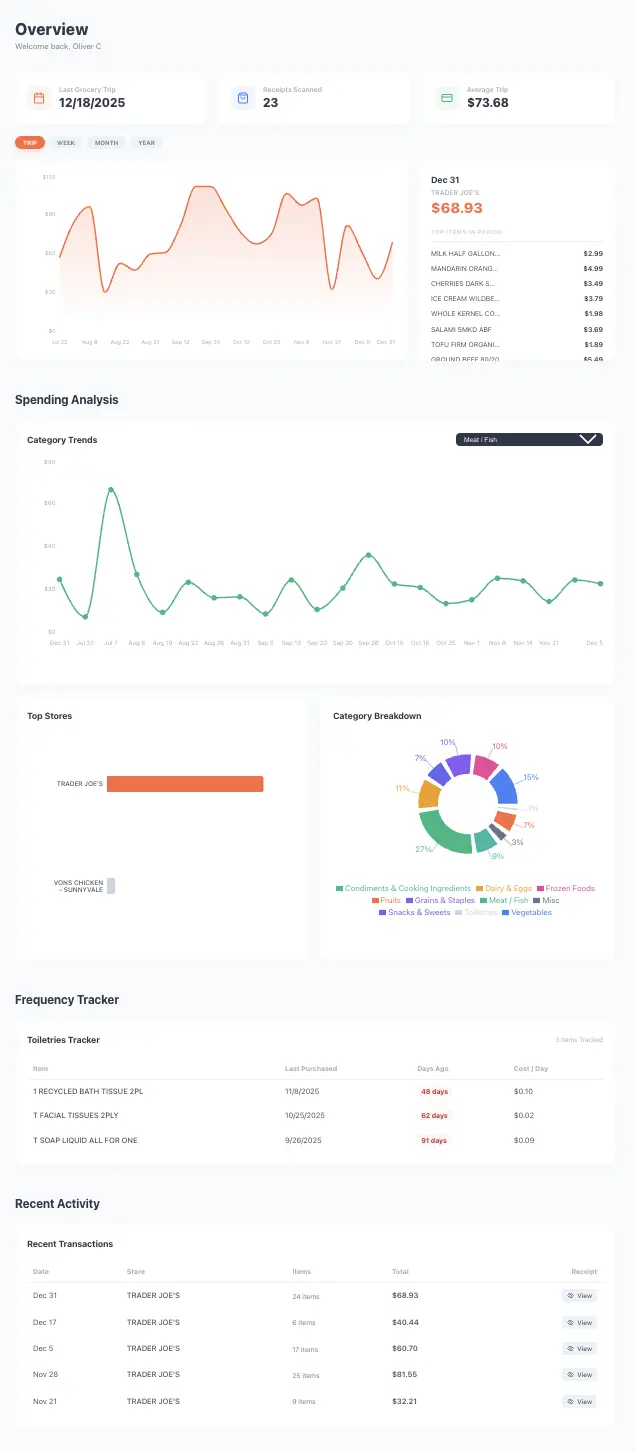
The frontend dashboard is not just a static display of data; it is a dynamic visualization engine. Below are the four core components that power the analytics, highlighting the logic used to transform raw SQL responses into interactive React components.

Toiletries Tracker

This tracker goes through how often I use common toiletry items. I wanted to see how often I used them and what happens to the daily cost when I average them over the amount of days.

ToiletriesTable.jsx
import React from 'react'

export default function ToiletriesTable({ transactions }) {
  // 1. Flatten all items with extra safety for empty transaction/item lists
  const toiletryItems = []

  if (transactions && Array.isArray(transactions)) {
    transactions.forEach(t => {
      // Guard against cases where receipt_items might be null
      const items = t.receipt_items || []

      items.forEach(item => {
        // Updated to be case-insensitive and match "Toiletries/Cleaning"
        if (item.category?.toLowerCase().includes("toiletries")) {
          toiletryItems.push({
            ...item,
            purchaseDate: new Date(t.purchase_date),
            // Ensure date parsing doesn't break UI
            formattedDate: t.purchase_date ? new Date(t.purchase_date).toLocaleDateString() : 'Unknown Date'
          })
        }
      })
    })
  }

  // Sort by newest first
  toiletryItems.sort((a,b) => b.purchaseDate - a.purchaseDate)

  // 2. Calculate stats with Safety Guards
  const today = new Date()
  const rows = toiletryItems.map(item => {
    const diffTime = Math.abs(today - item.purchaseDate)
    const daysSince = Math.ceil(diffTime / (1000 * 60 * 60 * 24))

    // Safety check: ensure price isn't null and daysSince isn't zero
    const safePrice = item.price || 0
    const costPerDay = daysSince > 0 ? (safePrice / daysSince) : safePrice

    return { ...item, daysSince, costPerDay, safePrice }
  })

  return (
    <div style={{ background: 'white', padding: '24px', borderRadius: '16px', boxShadow: '0 4px 6px rgba(0,0,0,0.02)' }}>
      <div style={{ display: 'flex', justifyContent: 'space-between', alignItems: 'center', marginBottom: '20px' }}>
        <h3 style={{ margin: 0, fontSize: '1.1rem', color: '#2d3748' }}>Toiletries Tracker</h3>
        <span style={{ fontSize: '0.8rem', color: '#a0aec0' }}>{rows.length} Items Tracked</span>
      </div>

      <table style={{width: '100%', borderCollapse: 'collapse'}}>
        <thead>
          <tr style={{textAlign: 'left', color: '#a0aec0', fontSize: '0.85rem', borderBottom: '1px solid #edf2f7'}}>
            <th style={{padding: '12px'}}>Item</th>
            <th style={{padding: '12px'}}>Last Purchased</th>
            <th style={{padding: '12px'}}>Days Ago</th>
            <th style={{padding: '12px'}}>Cost / Day</th>
          </tr>
        </thead>
        <tbody>
          {rows.map((row, idx) => (
            <tr key={idx} style={{borderBottom: '1px solid #f7fafc', fontSize: '0.95rem', color: '#4a5568'}}>
              <td style={{padding: '12px', fontWeight: '500'}}>
                {row.name || 'Unknown Product'}
              </td>
              <td style={{padding: '12px'}}>{row.formattedDate}</td>
              <td style={{padding: '12px'}}>
                <span style={{
                    background: row.daysSince > 30 ? '#fff5f5' : '#f0fff4',
                    color: row.daysSince > 30 ? '#c53030' : '#2f855a',
                    padding: '4px 8px', borderRadius: '6px', fontSize: '0.85rem', fontWeight: 'bold'
                }}>
                  {row.daysSince} days
                </span>
              </td>
              <td style={{padding: '12px'}}>
                {/* Applied the (value || 0) Safety Guard here */}
                ${(row.costPerDay || 0).toFixed(2)}
              </td>
            </tr>
          ))}
          {rows.length === 0 && (
            <tr>
              <td colSpan={4} style={{padding: '40px', textAlign: 'center', color: '#a0aec0'}}>
                <div style={{fontSize: '1.5rem', marginBottom: '8px'}}>๐Ÿฆ</div>
                No toiletries detected in your receipts yet.
              </td>
            </tr>
          )}
        </tbody>
      </table>
    </div>
  )
}

Spending Trends

The next thing I wanted to really understand was where my weekly grocery bills were going.

SpendingTrend.jsx
import React, { useState, useEffect, useMemo } from 'react'
import { AreaChart, Area, XAxis, YAxis, Tooltip, ResponsiveContainer, CartesianGrid } from 'recharts'
import { startOfWeek, startOfMonth, startOfYear, format } from 'date-fns'

export default function SpendingTrendWithBreakdown({ transactions }) {
  // Options: 'trip', 'week', 'month', 'year'
  const [groupBy, setGroupBy] = useState('trip')
  const [selectedPoint, setSelectedPoint] = useState(null)

  // 1. Transform and Aggregate Data based on Toggle
  const chartData = useMemo(() => {
    if (!transactions || transactions.length === 0) return []

    // Plot individual grocery trips
    if (groupBy === 'trip') {
      return transactions.map(t => ({
        date: format(new Date(t.purchase_date), 'MMM d'),
        amount: t.total_amount || 0,
        label: t.store_name || 'Unknown Store',
        items: t.receipt_items || [],
        rawDate: t.purchase_date
      }))
    }

    // Aggregate by Week, Month, or Year
    const groups = {}
    transactions.forEach(t => {
      const d = new Date(t.purchase_date)
      let key = ""
      let label = ""

      if (groupBy === 'week') {
        key = format(startOfWeek(d), 'MMM d, yyyy')
        label = "Weekly Spending"
      } else if (groupBy === 'month') {
        key = format(startOfMonth(d), 'MMM yyyy')
        label = "Monthly Spending"
      } else if (groupBy === 'year') {
        key = format(startOfYear(d), 'yyyy')
        label = "Yearly Spending"
      }

      if (!groups[key]) {
        groups[key] = { date: key, amount: 0, items: [], label: label }
      }
      groups[key].amount += (t.total_amount || 0)
      groups[key].items.push(...(t.receipt_items || []))
    })

    // Sort aggregated data by date
    return Object.values(groups).sort((a, b) => new Date(a.date) - new Date(b.date))
  }, [transactions, groupBy])

  // 2. Auto-select the latest data point when data or mode changes
  useEffect(() => {
    if (chartData.length > 0) {
      setSelectedPoint(chartData[chartData.length - 1])
    }
  }, [chartData])

  return (
    <div style={{ display: 'flex', flexDirection: 'column', gap: '16px' }}>

      {/* TIME RANGE SELECTOR */}
      <div style={{ display: 'flex', gap: '8px', marginBottom: '8px' }}>
        {['trip', 'week', 'month', 'year'].map(mode => (
          <button
            key={mode}
            onClick={() => setGroupBy(mode)}
            style={{
              padding: '6px 16px',
              borderRadius: '20px',
              border: 'none',
              cursor: 'pointer',
              fontSize: '0.75rem',
              fontWeight: '700',
              textTransform: 'uppercase',
              backgroundColor: groupBy === mode ? '#fe6b40' : '#edf2f7',
              color: groupBy === mode ? 'white' : '#718096',
              transition: 'all 0.2s cubic-bezier(0.4, 0, 0.2, 1)',
              boxShadow: groupBy === mode ? '0 4px 12px rgba(254, 107, 64, 0.2)' : 'none'
            }}
          >
            {mode}
          </button>
        ))}
      </div>

      <div style={{ display: 'grid', gridTemplateColumns: '2fr 1fr', gap: '24px', height: '400px' }}>

        {/* LEFT: The Spending Chart */}
        <div style={{ background: 'white', padding: '24px', borderRadius: '16px', boxShadow: '0 4px 6px rgba(0,0,0,0.02)' }}>
          <ResponsiveContainer width="100%" height="100%">
            <AreaChart
              data={chartData}
              onClick={(state) => {
                if (state && state.activePayload) {
                  setSelectedPoint(state.activePayload[0].payload)
                }
              }}
            >
              <defs>
                <linearGradient id="colorTrend" x1="0" y1="0" x2="0" y2="1">
                  <stop offset="5%" stopColor="#fe6b40" stopOpacity={0.2}/>
                  <stop offset="95%" stopColor="#fe6b40" stopOpacity={0}/>
                </linearGradient>
              </defs>
              <CartesianGrid strokeDasharray="3 3" vertical={false} stroke="#edf2f7" />
              <XAxis dataKey="date" axisLine={false} tickLine={false} tick={{fill: '#a0aec0', fontSize: 11}} dy={10} />
              <YAxis axisLine={false} tickLine={false} tick={{fill: '#a0aec0', fontSize: 11}} tickFormatter={v => `$${v}`} />
              <Tooltip
                contentStyle={{borderRadius: '12px', border: 'none', boxShadow: '0 10px 15px -3px rgba(0,0,0,0.1)'}}
                formatter={(value) => [`$${(value || 0).toFixed(2)}`, 'Total Spent']}
              />
              <Area
                type="monotone"
                dataKey="amount"
                stroke="#fe6b40"
                strokeWidth={3}
                fillOpacity={1}
                fill="url(#colorTrend)"
                activeDot={{ r: 6, strokeWidth: 0 }}
                style={{ cursor: 'pointer' }}
              />
            </AreaChart>
          </ResponsiveContainer>
        </div>

        {/* RIGHT: Breakdown Panel */}
        <div style={{ background: 'white', padding: '24px', borderRadius: '16px', boxShadow: '0 4px 6px rgba(0,0,0,0.02)', overflowY: 'auto' }}>
          {selectedPoint ? (
            <div>
              <h3 style={{ margin: '0', fontSize: '1.1rem', color: '#2d3748' }}>{selectedPoint.date}</h3>
              <div style={{marginBottom: '20px'}}>
                <div style={{fontSize: '0.85rem', color: '#a0aec0', fontWeight: '500'}}>{selectedPoint.label}</div>
                <div style={{fontSize: '1.8rem', fontWeight: '800', color: '#fe6b40'}}>
                  ${(selectedPoint.amount || 0).toFixed(2)}
                </div>
              </div>

              <h4 style={{fontSize: '0.7rem', color: '#cbd5e0', textTransform: 'uppercase', letterSpacing: '1px', borderBottom:'1px solid #edf2f7', paddingBottom:'8px', marginBottom:'12px'}}>
                  Top Items in Period
              </h4>

              <div style={{display: 'flex', flexDirection: 'column', gap: '10px'}}>
                {selectedPoint.items.slice(0, 15).map((item, idx) => (
                  <div key={idx} style={{display: 'flex', justifyContent: 'space-between', fontSize: '0.85rem'}}>
                    <span style={{color: '#4a5568', maxWidth:'140px', overflow:'hidden', textOverflow:'ellipsis', whiteSpace:'nowrap'}}>
                      {item.name || 'Unknown Item'}
                    </span>
                    <span style={{fontWeight: '600', color: '#2d3748'}}>
                        ${(item.price || 0).toFixed(2)}
                    </span>
                  </div>
                ))}
                {selectedPoint.items.length > 15 && (
                    <div style={{fontSize: '0.75rem', color:'#a0aec0', textAlign:'center', marginTop:'5px'}}>
                        + {selectedPoint.items.length - 15} more items
                    </div>
                )}
              </div>
            </div>
          ) : (
            <div style={{height: '100%', display: 'flex', alignItems: 'center', justifyContent: 'center', color: '#cbd5e0'}}>
              <p>Select a point to view spending</p>
            </div>
          )}
        </div>
      </div>
    </div>
  )
}

Item Price Tracker

I also wanted to track the price of each item over the course of the time. The advantage of having all of my friends use this app is that the increased sample size can help look at trends over time.

ItemPriceChart.jsx
// src/components/DashboardWidgets/ItemPriceChart.jsx
import React, { useState, useEffect, useRef } from 'react'
import { supabase } from '../../supabaseClient'
import { LineChart, Line, XAxis, YAxis, Tooltip, ResponsiveContainer, CartesianGrid, Legend } from 'recharts'
import { X, ChevronDown, Search } from 'lucide-react'

const LINE_COLORS = ['#ec4899', '#3b82f6', '#10b981', '#f59e0b', '#8b5cf6', '#fe6b40']

export default function ItemPriceChart() {
  const [availableItems, setAvailableItems] = useState([])
  const [selectedItems, setSelectedItems] = useState(['Eggs'])
  const [chartData, setChartData] = useState([])
  const [loading, setLoading] = useState(false)

  // -- NEW SEARCHABLE DROPDOWN STATE --
  const [searchTerm, setSearchTerm] = useState('')
  const [isDropdownOpen, setIsDropdownOpen] = useState(false)
  const dropdownRef = useRef(null)

  // 1. Fetch Item List on Mount
  useEffect(() => {
    fetchUniqueItems()

    // Click outside to close dropdown
    function handleClickOutside(event) {
      if (dropdownRef.current && !dropdownRef.current.contains(event.target)) {
        setIsDropdownOpen(false)
      }
    }
    document.addEventListener("mousedown", handleClickOutside)
    return () => document.removeEventListener("mousedown", handleClickOutside)
  }, [])

  // 2. Fetch Prices when Selection Changes
  useEffect(() => {
    if (selectedItems.length > 0) {
      fetchPriceHistory(selectedItems)
    } else {
      setChartData([])
    }
  }, [selectedItems])

  async function fetchUniqueItems() {
    try {
      const { data, error } = await supabase
        .from('receipt_items')
        .select('name')
        .order('name', { ascending: true })

      if (error) throw error

      const unique = [...new Set(data.map(i => i.name).filter(n => n && n.trim().length > 0))]
      setAvailableItems(unique)
    } catch (err) {
      console.error("Error fetching items:", err)
    }
  }

  async function fetchPriceHistory(itemsToFetch) {
    setLoading(true)
    try {
      const { data, error } = await supabase
        .from('receipt_items')
        .select(`
          name, price,
          receipts ( purchase_date )
        `)
        .in('name', itemsToFetch)
        .order('id', { ascending: true })

      if (error) throw error

      // Transform Data
      const rawPoints = []
      data.forEach(row => {
        if (!row.receipts || !row.receipts.purchase_date) return
        rawPoints.push({
          dateKey: new Date(row.receipts.purchase_date).toLocaleDateString('en-US', { month: 'short', day: 'numeric' }),
          rawDate: new Date(row.receipts.purchase_date),
          item: row.name,
          price: row.price
        })
      })

      rawPoints.sort((a, b) => a.rawDate - b.rawDate)

      const mergedMap = new Map()
      rawPoints.forEach(p => {
        const existing = mergedMap.get(p.dateKey) || { date: p.dateKey, rawDate: p.rawDate }
        existing[p.item] = p.price
        mergedMap.set(p.dateKey, existing)
      })

      setChartData(Array.from(mergedMap.values()))
    } catch (err) {
      console.error(err)
    } finally {
      setLoading(false)
    }
  }

  // -- DROPDOWN LOGIC --
  const handleAddItem = (item) => {
    if (!selectedItems.includes(item)) {
      setSelectedItems([...selectedItems, item])
    }
    setSearchTerm('') // Clear input
    setIsDropdownOpen(false) // Close menu
  }

  const handleRemoveItem = (itemToRemove) => {
    setSelectedItems(selectedItems.filter(i => i !== itemToRemove))
  }

  // Filter the list based on what user is typing
  const filteredItems = availableItems.filter(item =>
    item.toLowerCase().includes(searchTerm.toLowerCase())
  )

  return (
    <div style={{ background: 'white', padding: '24px', borderRadius: '16px', boxShadow: '0 4px 6px rgba(0,0,0,0.02)', minHeight: '500px' }}>

      <div style={{marginBottom: '20px'}}>
        <div style={{display: 'flex', justifyContent: 'space-between', alignItems: 'center', marginBottom: '12px'}}>
          <h3 style={{ margin: 0, fontSize: '1.1rem', color: '#2d3748' }}>Price Tracker</h3>
            {loading && <span style={{fontSize: '0.8rem', color: '#a0aec0'}}>Updating...</span>}
        </div>

        {/* --- SEARCHABLE DROPDOWN CONTAINER --- */}
        <div ref={dropdownRef} style={{position: 'relative', maxWidth: '400px'}}>

          {/* Input Box */}
          <div style={{position: 'relative', display: 'flex', alignItems: 'center'}}>
            <Search size={16} color="#a0aec0" style={{position: 'absolute', left: '12px'}}/>
            <input
              type="text"
              value={searchTerm}
              onChange={(e) => {
                setSearchTerm(e.target.value)
                setIsDropdownOpen(true)
              }}
              onFocus={() => setIsDropdownOpen(true)}
              placeholder="Search or Select item..."
              style={{
                width: '100%', padding: '10px 10px 10px 38px',
                borderRadius: '8px', border: '1px solid #e2e8f0',
                fontSize: '0.9rem', outline: 'none'
              }}
            />
            <ChevronDown size={16} color="#a0aec0" style={{position: 'absolute', right: '12px', pointerEvents: 'none'}}/>
          </div>

          {/* Floating List */}
          {isDropdownOpen && (
            <div style={{
              position: 'absolute', top: '100%', left: 0, right: 0,
              background: 'white', border: '1px solid #e2e8f0',
              borderRadius: '8px', marginTop: '4px',
              maxHeight: '200px', overflowY: 'auto',
              boxShadow: '0 4px 12px rgba(0,0,0,0.1)',
              zIndex: 50
            }}>
              {filteredItems.length > 0 ? (
                filteredItems.map(item => (
                  <div
                    key={item}
                    onClick={() => handleAddItem(item)}
                    style={{
                      padding: '10px 12px', cursor: 'pointer', fontSize: '0.9rem', color: '#4a5568',
                      borderBottom: '1px solid #f7fafc',
                      background: selectedItems.includes(item) ? '#f0fff4' : 'white' // Highlight if already selected
                    }}
                    onMouseOver={(e) => !selectedItems.includes(item) && (e.currentTarget.style.background = '#edf2f7')}
                    onMouseOut={(e) => !selectedItems.includes(item) && (e.currentTarget.style.background = 'white')}
                  >
                    {item} {selectedItems.includes(item) && 'โœ“'}
                  </div>
                ))
              ) : (
                <div style={{padding: '12px', color: '#a0aec0', fontSize: '0.85rem', textAlign: 'center'}}>
                   No items found matching "{searchTerm}"
                </div>
              )}
            </div>
          )}
        </div>

        {/* SELECTED CHIPS */}
        <div style={{display: 'flex', flexWrap: 'wrap', gap: '8px', marginTop: '12px'}}>
          {selectedItems.map((item, idx) => (
            <div key={item} style={{
              display: 'flex', alignItems: 'center', gap: '6px',
              padding: '4px 10px', borderRadius: '20px',
              background: `${LINE_COLORS[idx % LINE_COLORS.length]}15`,
              color: LINE_COLORS[idx % LINE_COLORS.length],
              fontSize: '0.85rem', fontWeight: '600'
            }}>
              {item}
              <button
                onClick={() => handleRemoveItem(item)}
                style={{border: 'none', background: 'none', cursor: 'pointer', padding: 0, display: 'flex'}}
              >
                <X size={14} color={LINE_COLORS[idx % LINE_COLORS.length]} />
              </button>
            </div>
          ))}
        </div>
      </div>

      {/* CHART */}
      <div style={{height: '350px'}}>
        {selectedItems.length > 0 && chartData.length > 0 ? (
          <ResponsiveContainer width="100%" height="100%">
            <LineChart data={chartData}>
              <CartesianGrid strokeDasharray="3 3" vertical={false} stroke="#edf2f7" />
              <XAxis dataKey="date" axisLine={false} tickLine={false} tick={{fill: '#a0aec0', fontSize: 12}} dy={10} />
              <YAxis axisLine={false} tickLine={false} tick={{fill: '#a0aec0', fontSize: 12}} tickFormatter={v => `$${v}`} />
              <Tooltip
                 contentStyle={{borderRadius: '8px', border: 'none', boxShadow: '0 4px 12px rgba(0,0,0,0.1)'}}
                 formatter={(value, name) => [`$${value.toFixed(2)}`, name]}
              />
              <Legend verticalAlign="top" height={36}/>
              {selectedItems.map((item, idx) => (
                <Line
                  key={item}
                  type="monotone"
                  dataKey={item}
                  stroke={LINE_COLORS[idx % LINE_COLORS.length]}
                  strokeWidth={3}
                  dot={{fill: LINE_COLORS[idx % LINE_COLORS.length], r: 3}}
                  connectNulls={true}
                />
              ))}
            </LineChart>
          </ResponsiveContainer>
        ) : (
           <div style={{height: '100%', display: 'flex', alignItems: 'center', justifyContent: 'center', color: '#a0aec0'}}>
             {selectedItems.length === 0 ? "Select an item to begin" : "No price history found for these items."}
           </div>
        )}
      </div>
    </div>
  )
}

Multi-Category Analysis

Similar to the previous graph but in pie chart form!

CategoryLineChart.jsx
import React, { useState, useMemo } from 'react'
import { LineChart, Line, XAxis, YAxis, Tooltip, ResponsiveContainer, CartesianGrid, Legend } from 'recharts'

const VALID_CATEGORIES = [
  "Fruits", "Vegetables", "Meat / Fish", "Dairy & Eggs",
  "Grains & Staples", "Frozen Foods", "Snacks & Sweets",
  "Condiments & Cooking Ingredients", "Toiletries/Cleaning", "Misc"
]

const CATEGORY_COLORS = {
  "Fruits": "#fe6b40",
  "Vegetables": "#3b82f6",
  "Meat / Fish": "#10b981",
  "Dairy & Eggs": "#f59e0b",
  "Grains & Staples": "#8b5cf6",
  "Frozen Foods": "#ec4899",
  "Snacks & Sweets": "#6366f1",
  "Condiments & Cooking Ingredients": "#14b8a6",
  "Toiletries/Cleaning": "#f97316",
  "Misc": "#64748b"
}

export default function CategoryLineChart({ transactions }) {
  // 1. Change to an array to support multiple selections
  const [selectedCategories, setSelectedCategories] = useState(["Meat / Fish", "Vegetables"])

  const chartData = useMemo(() => {
    if (!transactions) return []

    // Group totals by date
    const dateMap = {}

    transactions.forEach(t => {
      const dateKey = new Date(t.purchase_date).toLocaleDateString('en-US', { month: 'short', day: 'numeric' })
      const rawDate = t.purchase_date

      if (!dateMap[dateKey]) {
        dateMap[dateKey] = { date: dateKey, rawDate: rawDate }
        // Initialize all valid categories to 0 for this date
        VALID_CATEGORIES.forEach(cat => dateMap[dateKey][cat] = 0)
      }

      const items = t.receipt_items || []
      items.forEach(item => {
        if (VALID_CATEGORIES.includes(item.category)) {
          dateMap[dateKey][item.category] += (item.price || 0)
        }
      })
    })

    return Object.values(dateMap).sort((a, b) => new Date(a.rawDate) - new Date(b.rawDate))
  }, [transactions])

  const toggleCategory = (category) => {
    setSelectedCategories(prev =>
      prev.includes(category)
        ? prev.filter(c !== category)
        : [...prev, category]
    )
  }

  return (
    <div style={{ background: 'white', padding: '24px', borderRadius: '16px', boxShadow: '0 4px 6px rgba(0,0,0,0.02)', height: '550px' }}>
      <h3 style={{ margin: '0 0 16px 0', fontSize: '1.1rem', color: '#2d3748' }}>Multi-Category Overlay</h3>

            {/* Category Pill Selectors */}
      <div style={{ display: 'flex', flexWrap: 'wrap', gap: '8px', marginBottom: '24px' }}>
        {VALID_CATEGORIES.map(cat => {
          const isActive = selectedCategories.includes(cat)
          return (
            <button
                    key={cat}
                    onClick={() => toggleCategory(cat)}
              style={{
                padding: '6px 12px',
                borderRadius: '20px',
                border: `1px solid ${isActive ? CATEGORY_COLORS[cat] : '#edf2f7'}`,
                backgroundColor: isActive ? CATEGORY_COLORS[cat] : 'transparent',
                color: isActive ? 'white' : '#a0aec0',
                fontSize: '0.75rem',
                fontWeight: '600',
                cursor: 'pointer',
                transition: 'all 0.2s'
              }}
            >
              {cat}
            </button>
            )
        })}
    </div>

    <ResponsiveContainer width="100%" height="70%">
        <LineChart data={chartData}>
            <CartesianGrid strokeDasharray="3 3" vertical={false} stroke="#edf2f7" />
            <XAxis dataKey="date" axisLine={false} tickLine={false} tick={{fill: '#a0aec0', fontSize: 11}} dy={10} />
            <YAxis axisLine={false} tickLine={false} tick={{fill: '#a0aec0', fontSize: 11}} tickFormatter={v => `$${v}`} />

            <Tooltip
                    contentStyle={{borderRadius: '12px', border: 'none', boxShadow: '0 10px 15px -3px rgba(0,0,0,0.1)'}}
            formatter={(value) => [`$${(value || 0).toFixed(2)}`]} // Safety guard
            />
            <Legend iconType="circle" wrapperStyle={{ paddingTop: '20px' }} />

            {/* Dynamically render a Line for each selected category */}
            {selectedCategories.map(cat => (
            <Line
                    key={cat}
                    type="monotone"
                    dataKey={cat}
                    name={cat}
                    stroke={CATEGORY_COLORS[cat]}
                    strokeWidth={3}
                    dot={{fill: CATEGORY_COLORS[cat], r: 4}}
                    activeDot={{r: 6, strokeWidth: 0}}
                    connectNulls={true} // Keeps line continuous if a date has $0 for that category
            />
            ))}
        </LineChart>
    </ResponsiveContainer>
</div>
)
}

Raspberry Pi Integration

While the React frontend lives on the edge via Vercel, the Python Discord bot requires a persistent, long-running process. To avoid the recurring costs of cloud VPS providers (ex. AWS), I deployed the backend on a Raspberry Pi 4 acting as a dedicated home server.

Conclusion

Through this project, I learned so much about software development andhow to use each tool and service in tandem with one another. I'm excited to add more data points and functions to this app and continue development based on my own user experience!